

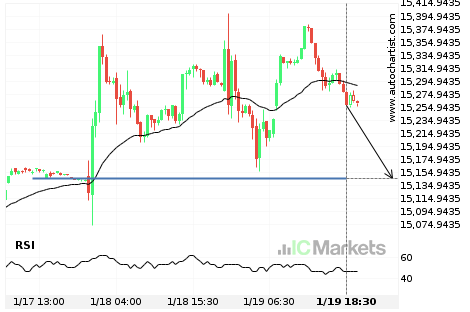
FTSE China A50 Index approaching important 15145.3799 price line
FTSE China A50 Index is approaching the support line of a Support. It has touched this line numerous times in the last 3 days. If it tests this line again, it could do so in the next 9 hours.
FTSE China A50 Index approaching important 15145.3799 price line
FTSE China A50 Index is approaching the support line of a Support. It has touched this line numerous times in the last 3 days. If it tests this line again, it could do so in the next 9 hours.
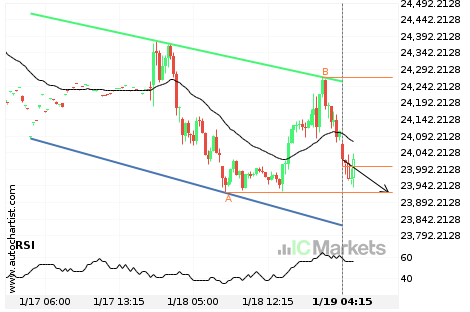
Will Hong Kong 50 Index have enough momentum to break support?
Hong Kong 50 Index is heading towards the support line of a Channel Down and could reach this point within the next 8 hours. It has tested this line numerous times in the past, and this time could be no different from the past, ending in a rebound instead of a breakout. If the breakout […]
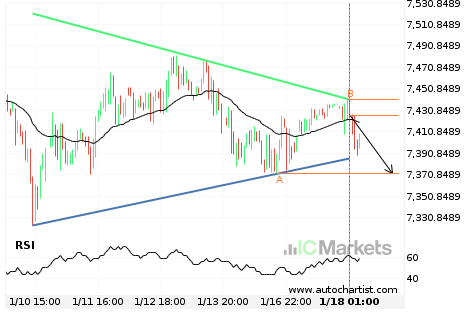
Will Australia 200 Index have enough momentum to break support?
Australia 200 Index is heading towards the support line of a Triangle and could reach this point within the next 2 days. It has tested this line numerous times in the past, and this time could be no different from the past, ending in a rebound instead of a breakout. If the breakout doesn’t happen, […]

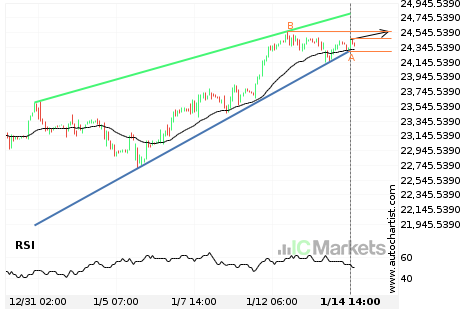
Possible breach of resistance level by Hong Kong 50 Index
Hong Kong 50 Index is moving towards a resistance line which it has tested numerous times in the past. We have seen it retrace from this line before, so at this stage it isn’t clear whether it will breach this line or rebound as it did before. If Hong Kong 50 Index continues in its […]
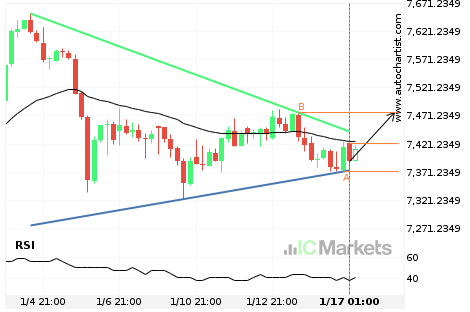
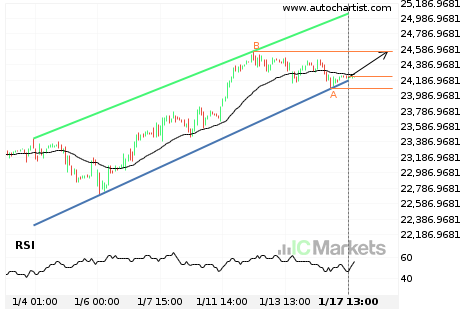
Should we expect a breakout or a rebound on Australia 200 Index?
The movement of Australia 200 Index towards the resistance line of a Triangle is yet another test of the line it reached numerous times in the past. This line test could happen in the next 3 days, but it is uncertain whether it will result in a breakout through this line, or simply rebound back […]

Possible breach of resistance level by Hong Kong 50 Index
Hong Kong 50 Index is moving towards a resistance line which it has tested numerous times in the past. We have seen it retrace from this line before, so at this stage it isn’t clear whether it will breach this line or rebound as it did before. If Hong Kong 50 Index continues in its […]
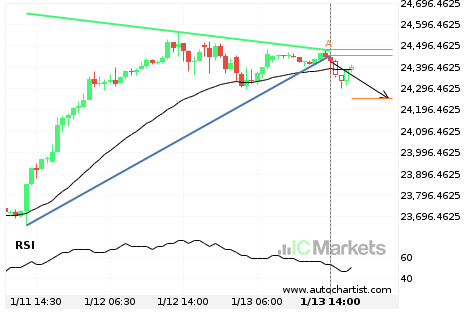
A possible start of a bearish trend on Hong Kong 50 Index
Hong Kong 50 Index has broken through a support line of a Triangle chart pattern. If this breakout holds true, we may see the price of Hong Kong 50 Index testing 24251.4879 within the next 7 hours. But don’t be so quick to trade, it has tested this line in the past, so you should […]